
It will arrive directly by mail, with no waiting time
THE OFFER ENDS...
00Hours
00Mins
00Secs
THE OFFER ENDS...
00Hours
00Minutes
00Seconds
ARE YOU READY FOR THE FUTURE
00Hours
00Minutes
00Seconds
ARE YOU READY FOR THE FUTURE
CAN YOU TELL US HOW WAS
A BORN
GRAPHEARTH ?
"Graphearth" was born for helping all creators
in the graphic field, for have quality products
at competitive prices.
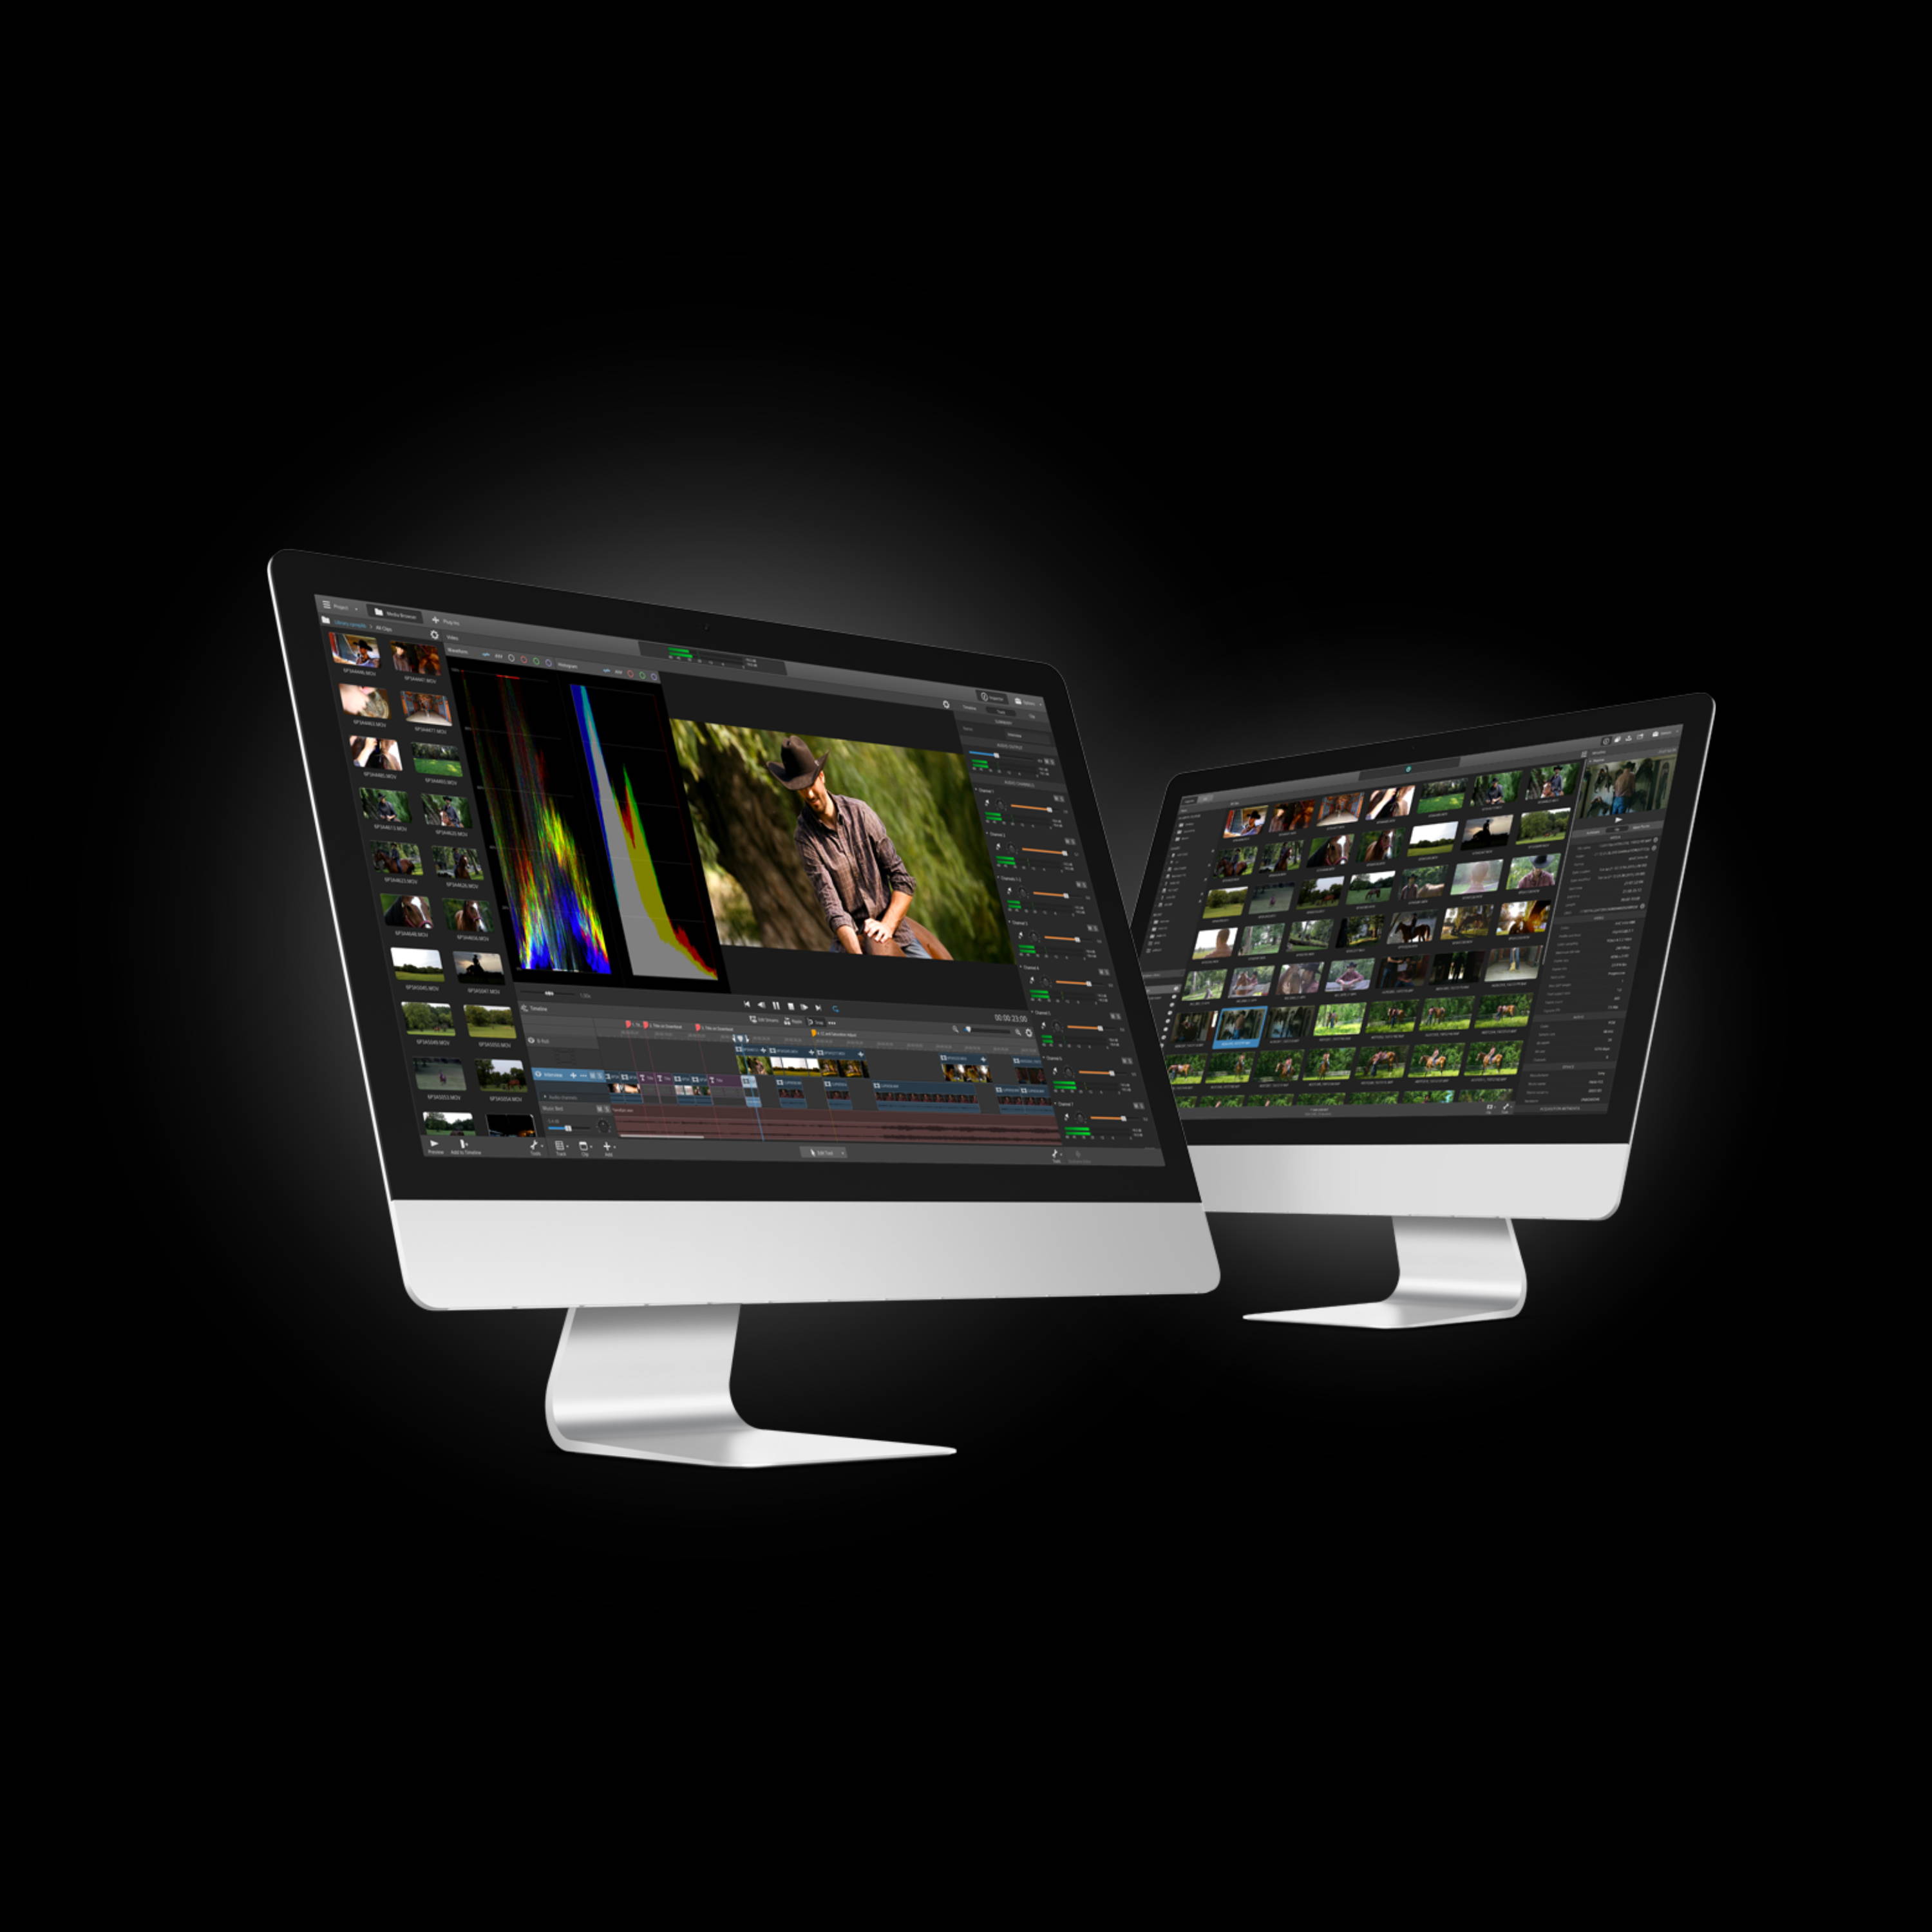
All of the product you see on our store,
has been created by experts who have working in video editing and photography.
To offer you the best product on the market !
WHY YOU HAVE TO CHOOSE GRAPHEARTH
Tired of the usual overlay?
That's why you chose GRAPHEARTH
Only if you are looking for the top in this world, we do for you!
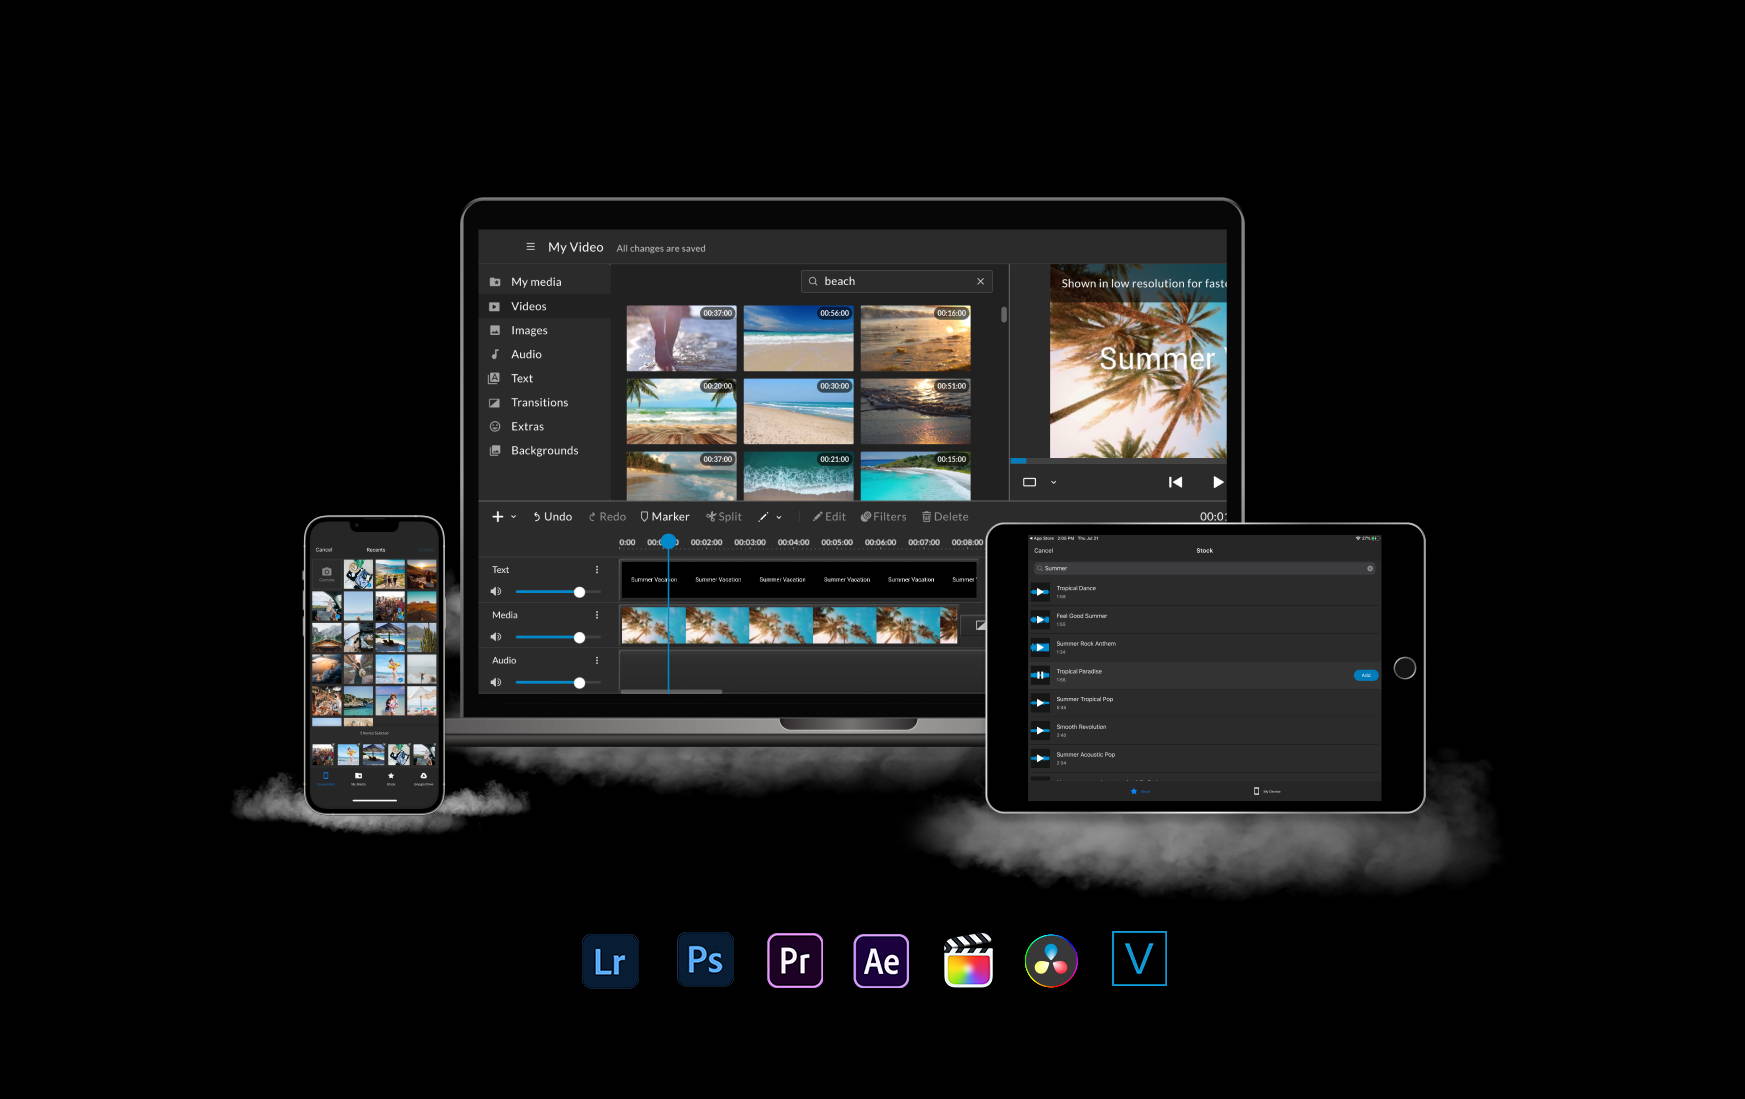
Compatible with all devices.
New coming soon...
Easy to use
Instant Download
100% Payment secure
One Time Installation
Edit 2x Faster
200+ Overlay
FAQ
How can I receive the product that I had bought?
Where do i go if i need help?
Don't hesitate to contact us on graphearth1@support.com
Why should i use these for my videos?
Our products speed up your workflow and add a unique style to your projects
How did other people find with this product?
They had found very well, we are imposing ourselves on the market with a quality product
When will I receive notification of my purchase?
you will receive an instant notification
VERIFIED REVIEWS

Check out what people are saying about our products.

Sarah McKenny
"The options are many and great in variety as well."

Alexia Russo
“I found Graphearth on social and watched some of the cool effect."

Linda Brown
“I have no words, the product it's perfect"
Kevin Braun
"I will continue to buy on graphearth!!"

Susan Miller
"It's not difficult to use"
Charlotte Dubois
“no defects, only merits for this super store"
Lucas White
"I like this product so much!"
Paola Ortega
"I received this product in 2 minute, compliments Graphearth"